Load Testing Riemann
Here we go, my first attempt at a blog…
I wrote a load testing tool for Riemann. The tool opens a configurable number of connections and worker threads and continuously pummels Riemann with events. The code can be found here. Part of why I wrote this tool was to try to idenfity Riemann’s limits. The tool uses a Riemann client, which I also wrote, to keep pressure on Riemann. The load tool places hooks into various places in the client pipeline to track it’s performance. The following metrics are kept:
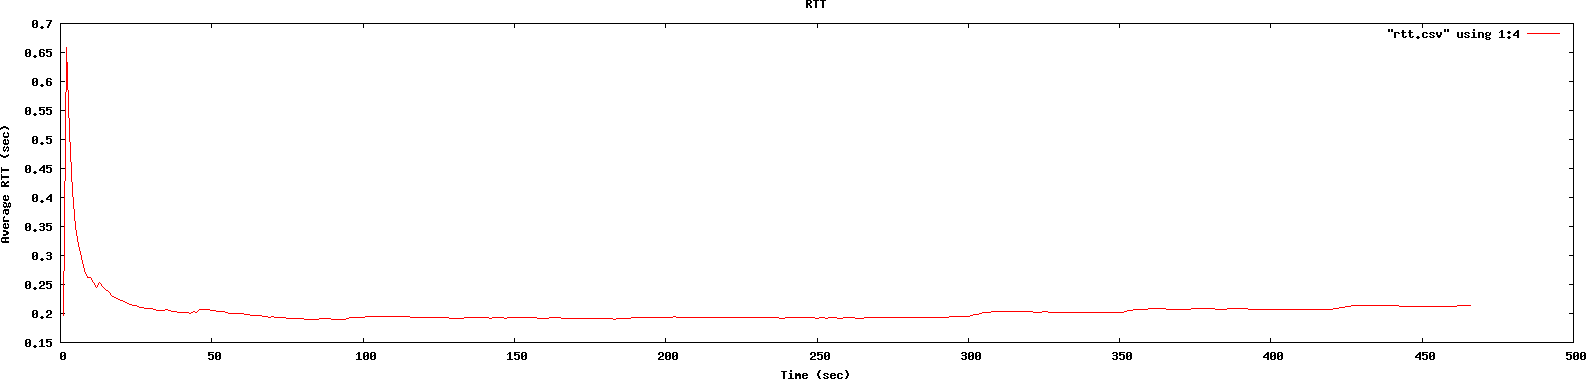
- The round trip time of a message and it’s ack.
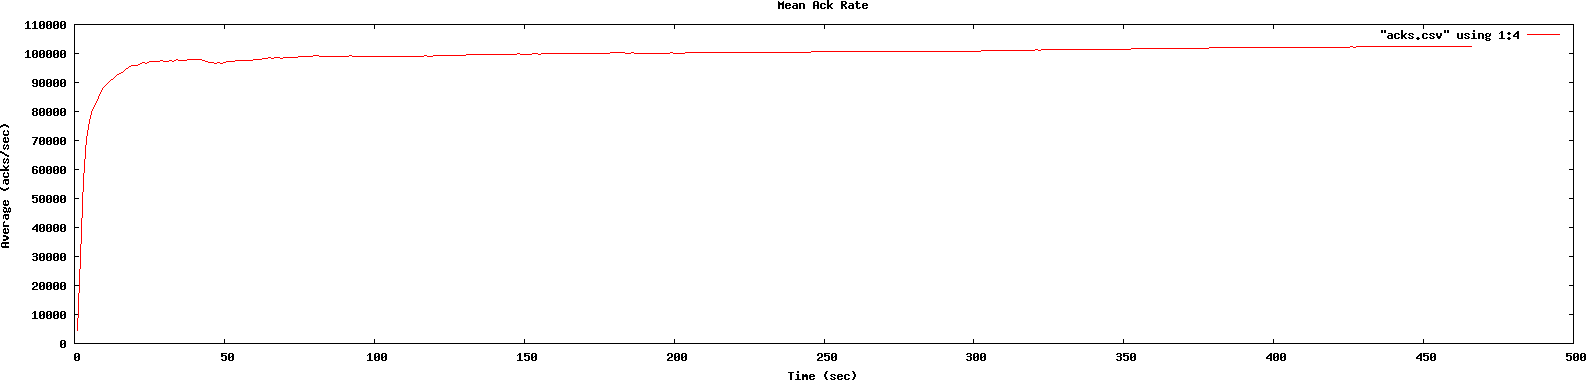
- The rate at which acks are received at the client.
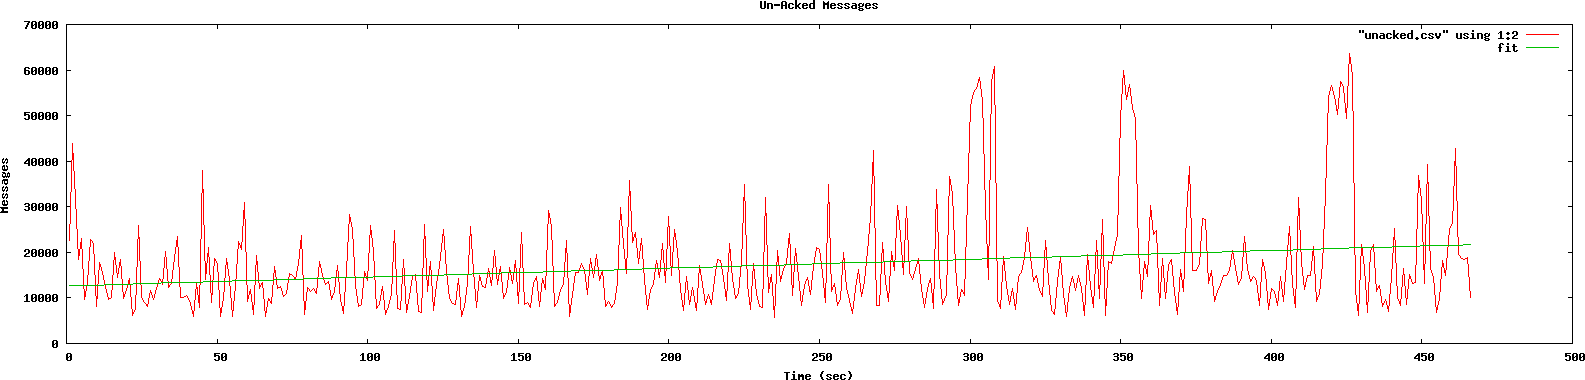
- The number of outstanding, unacked, requests.
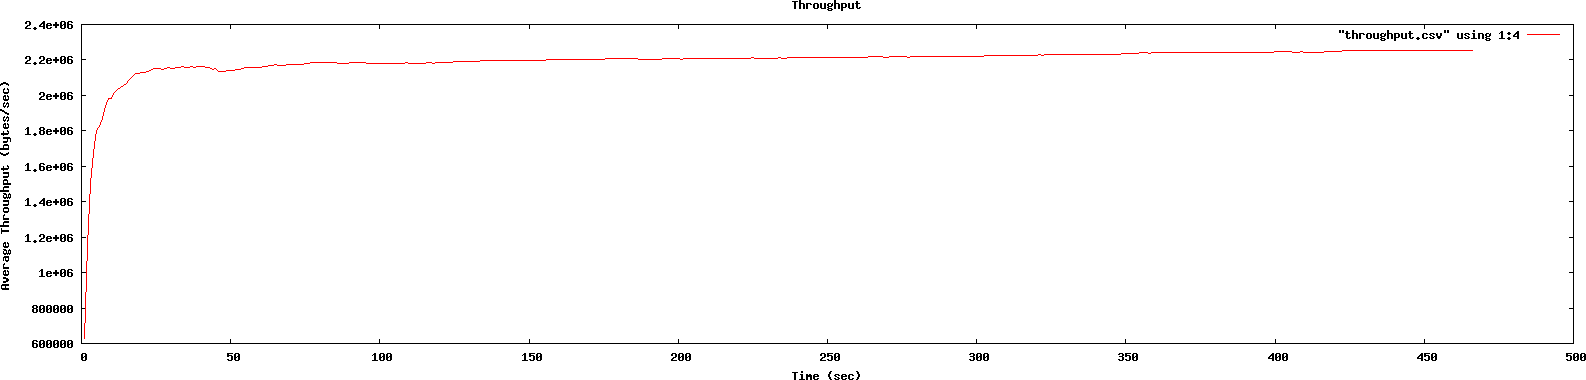
- The average network throughput.
There are two interesting scenarios: sending Msg packets containing single events. Sending Msg packets containing a large number of events. I refer to these two scenarios as single event sends and bulk sends respectively. This post only addresses the first scenario, I will address the bulk send scenario in a later post.
Single Event Sends
Test Environment
I ran this test on a mostly unoccupied iMac with the following CPU info: Intel(R) Core(TM) i7-2600 CPU @ 3.40GHz and 16 GB RAM. Riemann is 0.1.6-SNAPSHOT. It was sunny and 65 degrees, a slight breeze out of the SouthWest and some scattered whispy clouds. The client JVM ran with -XX:+UseConcMarkSweepGC -d64 and riemann was run with the aggressive flag (-a).
Riemann Config
Invocation
riemann-load.sh localhost:5555
Results
Summary
Approximate values
| Metric | Value |
|---|---|
| Send Rate | 100K msg/sec |
| Ack Rate | 100K ack/sec |
| Un-Acked | 15K msg |
| RTT | 0.2 sec |
| Throughput | 200 mbps |
The results are all pretty self explanatory. For the most part the lines are straight and flat, which is what I would expect on a well behaving system. The only wierdness is with the large spikes in the unacked events graph, as well as the upward trend. My intuition tells me that the spikes are due to GC events. However, since I did not collect this data I cannot be sure; I plan on collecting this and graphing it alongside this data in future runs. As we might also expect, as the buffer of unacked events begins to grow, so does the average latency, but it appears to begin flattening out. I’ll have to do some more runs to make sure.
Sends/Ack Rate
Outstanding Un-Acked Events
Round Trip Time
Throughput
blog comments powered by Disqus